Visualising the tile size distribution
With mp.py’s offsets command we can dump tile byte
position, size, width and height as follows:
./src/mp.py -c offsets dsatnord.mp > offsets.tsv
Let us read this file into a Pandas dataframe for analysis:
import pandas as pd

df = pd.read_csv("../offsets.tsv", sep='\t', names=["pos", "off", "c", "size", "width", "height"])
How many tiles of which size do we have?
df[["width", "height"]].value_counts()
| width | height | count |
|---|---|---|
| 1000 | 1000 | 24701 |
| 500 | 500 | 2409 |
| 250 | 250 | 20 |
Let us now visualise the position and size of the tiles:
import matplotlib.pyplot as plt

plt.rcParams['figure.figsize'] = [15, 8]

df_b = df[df["width"] == 1000]
df_m = df[df["width"] == 500]
df_s = df[df["width"] == 250]

plt.plot(df_b["pos"], df_b["size"], 'o', markersize=1, label="1000x1000 Pixel")
plt.plot(df_m["pos"], df_m["size"], 'o', markersize=1, label="500x500 Pixel")
plt.plot(df_s["pos"], df_s["size"], 'o', markersize=1, label="250x250 Pixel")
plt.xlabel("byte offset")
plt.ylabel("size in bytes")
plt.legend()
plt.show()
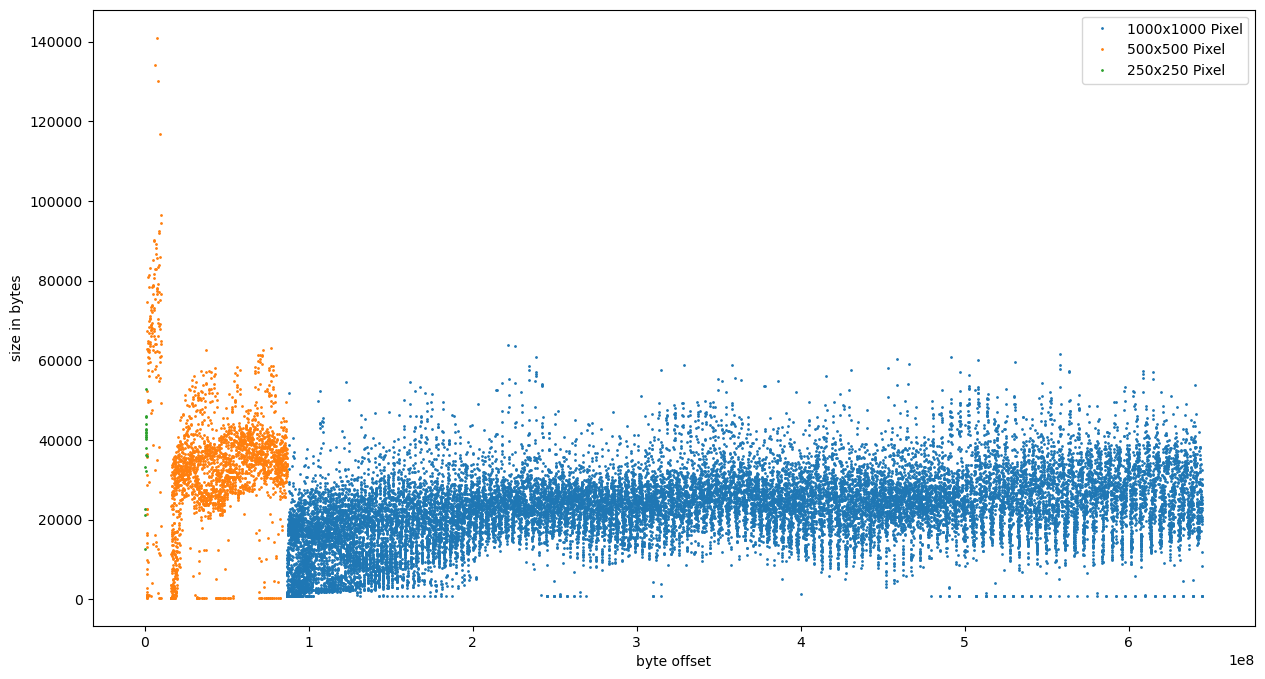
So the roughly 2400 tiles of size 500x500 come early on and they are, on average, larger than the 1000x1000 tiles. Very likely they are the colored overview tiles. Then follow the 24700 tiles of size 1000x1000 – very likely greyscale detailed images.
After extracting a sample of tiles from each size I can confirm that:
- The 20 tiles of size 250x250 are in color and provide the lowest resolution overview on Germany.
- The 2409 tiles of size 500x500 are in color and provide the first (and probably second) zoom level.
- The 24701 tiles of size 1000x1000 are in greyscale and provide the highest zoom level.